Refererence:
https://www.nature.com/articles/24103.pdf
Discovery of a young nearby supernova remnant
Bernd Aschenbach
Nature volume 396, pages141–142 (1998)
containing this graphic:
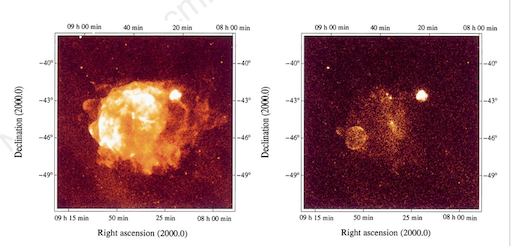
We load ROSAT Vela data (from the survey) and generate a 3D cube with pi as the 3rd axis. (You can flip between the cube and the original with the > or < keys.) With a bin width of 128 (i.e. cube slices of pi=1:128 and pi=129:256), Vela Jr pops out as you switch between slices (using Next or Blink in the FITS data cube plugin.)
If you change the bin width to create a cube with a different 3rd dimension, it is still possible to see Vela Jr, but less obvious as the slices get narrower.
JS9 uses high-level C routines filterTableToImage() and getImageToArray() to generate a 3D cube and flip between slices. We should be able to do this automatically, i.e. using algorithm(s) to explore different sets of slices, without needing to evaluate the results by eye.
|
|
bin width:
Refererence:
https://www.nature.com/articles/24103.pdf
containing this graphic:
|